Apr 17, 2008 - Sale 2142

Sale 2142 - Lot 102

Unsold
Estimate: $ 4,000 - $ 5,000
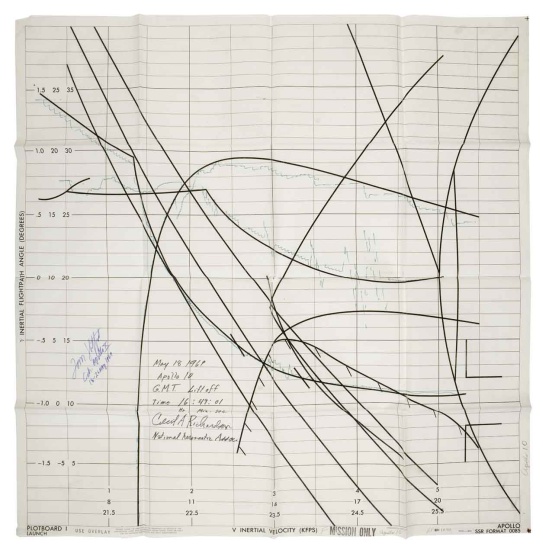
AN ARTIFACT FROM MISSION CONTROLApollo 10 Launch Plotting Chart, Signed. An approximately 30x30 inch chart that measures launch vehicle Inertial Velocity in KFPS (1000 feet per second) versus Inertial Flight Path Angle in degrees. Heavy pencil-line curves plot the nominal or expected flight paths. A finer green line plots the actual flight path measurements. Date stamped May 18, 1969, stamped "MISSION ONLY," referring to use only on the actual mission. signed by mission commander stafford. Folded to approximately 8x10 inches. ACIC for NASA/MSC, 1969

Additional Details

actual plotting chart used in mission control that measured telemetry from the apollo 10 saturn V vehicle, which carried the first lunar module to the moon. unique for apollo 10.
Very few charts from the plotting devices used in Mission Control have survived. The chart was placed on "Plot Board 1 - Launch" in the Mission Control Center. The green plotting line follows the heavy pencil outline almost perfectly during initial measurements. As the launch progressed, small deviations appeared that were not large enough to be a danger. Certified and signed when removed from the plot board: "May 18, 1969, Apollo 10, G.M.T. Liftoff Time 16:49:01 Hr, Min, Sec, Cecil A. Richardson, National Aeronautic Assoc." Additionally signed and inscribed: "Tom Stafford, Cdr, Apollo X, 18 - 26 May 1969."